
Last Updated on 4 months by Christopher Jan Benitez
80% of all SaaS revenue will come from just 20% of its customers.
The 80/20 rule is still alive.
An increase in retention of just 5% can increase your profitability by 75%!
What if I told you there was a way to find those 5%? And even predict where they’ll come from?
Read on and learn the secrets of using Cohort Analysis for Conversion Optimization.
1. What Is Cohort Analysis?
The Conversion Funnel is one of those essential digital marketing concepts. In practice, it allows you to monitor incoming traffic, how much of that is transforming into email subscribers and, ultimately, how your conversions are doing.
And that’s a good thing, It’s a very powerful element. However, it’s main flaw stems from its lack of predictive abilities. Sure, you can look at a current funnel and assume that the Conversion Rates will be the same. But is the data really helping you make informed decisions?
Enter the Cohort Analysis. This splits visitors into groups, based on a common characteristic, and compares their behavior over time.
Cohorts have commonly been used in the medical field, to study the impact of drugs and vaccines, over long periods of time. For example, people born in the same year share what is called a “Birth Cohort”. Within that cohort there can be subgroups formed – Birth Cohort + Location Cohort, Sex Cohort, etc.
A great (illustrated) example of Cohorts can be found on this RJMetrics microsite. It makes it easy to understand what Cohorts are and what their use cases are. Let’s continue and take a closer look at the benefits of this type of analysis.
2. What Are The Benefits Of Cohort Analysis?

We must stress this again: the Booking Funnel is not broken. It’s still a very capable tool and definitely one you should have in your marketing arsenal. If, however, you run more of a SaaS business, Cohort Analysis will provide more actionable data for you to look at and use.
- It’s predictive.
Since you’ll be looking at data over weeks and months, trends will emerge. Just like with a marketing funnel, Conversion Rates will never stay the same over time. However, Cohort Analysis provides a more granular view on how your visitors are behaving on your website.
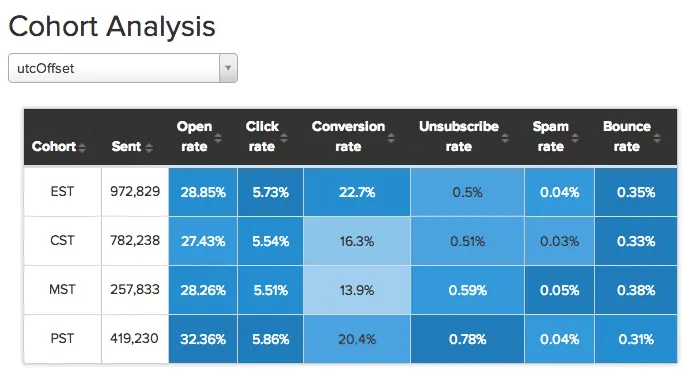
You’ll be able to predict how certain cohorts will act. For example, you might notice that visitors coming from specific search ads are converting at a higher rate than visitors from a blog post. It only makes sense – visitors in search are already looking for a solution to their problem, while blog readers are not in “buy mode” yet.
On the other hand, looking at costs, you might be able to say that a blog post converts fewer people, but it also has lower overall costs. So it would make sense to create more posts (on your own website + guest posts) and track those over time.
- It’s customizable.
With Cohort Analysis, you’re not limited to looking at just one thing. It does get a bit more complicated, if you insert multiple sources and demographics data, but as long as you don’t get carried away, you should be ok.
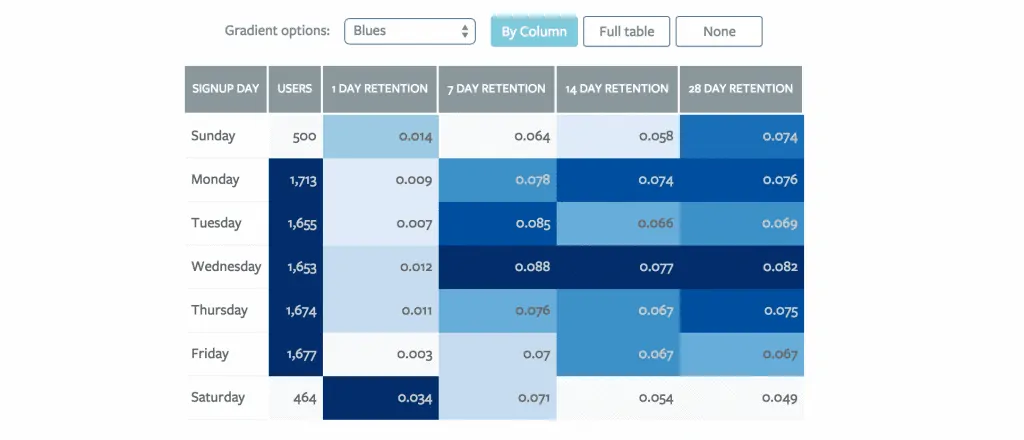
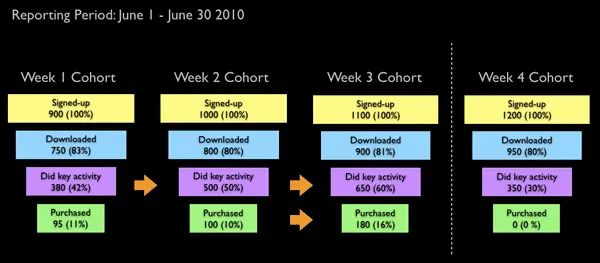
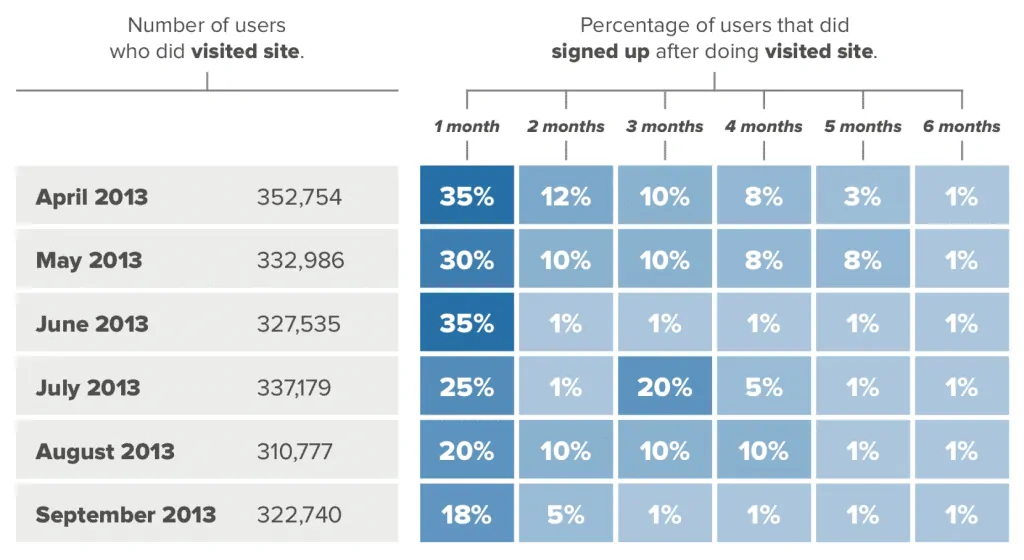
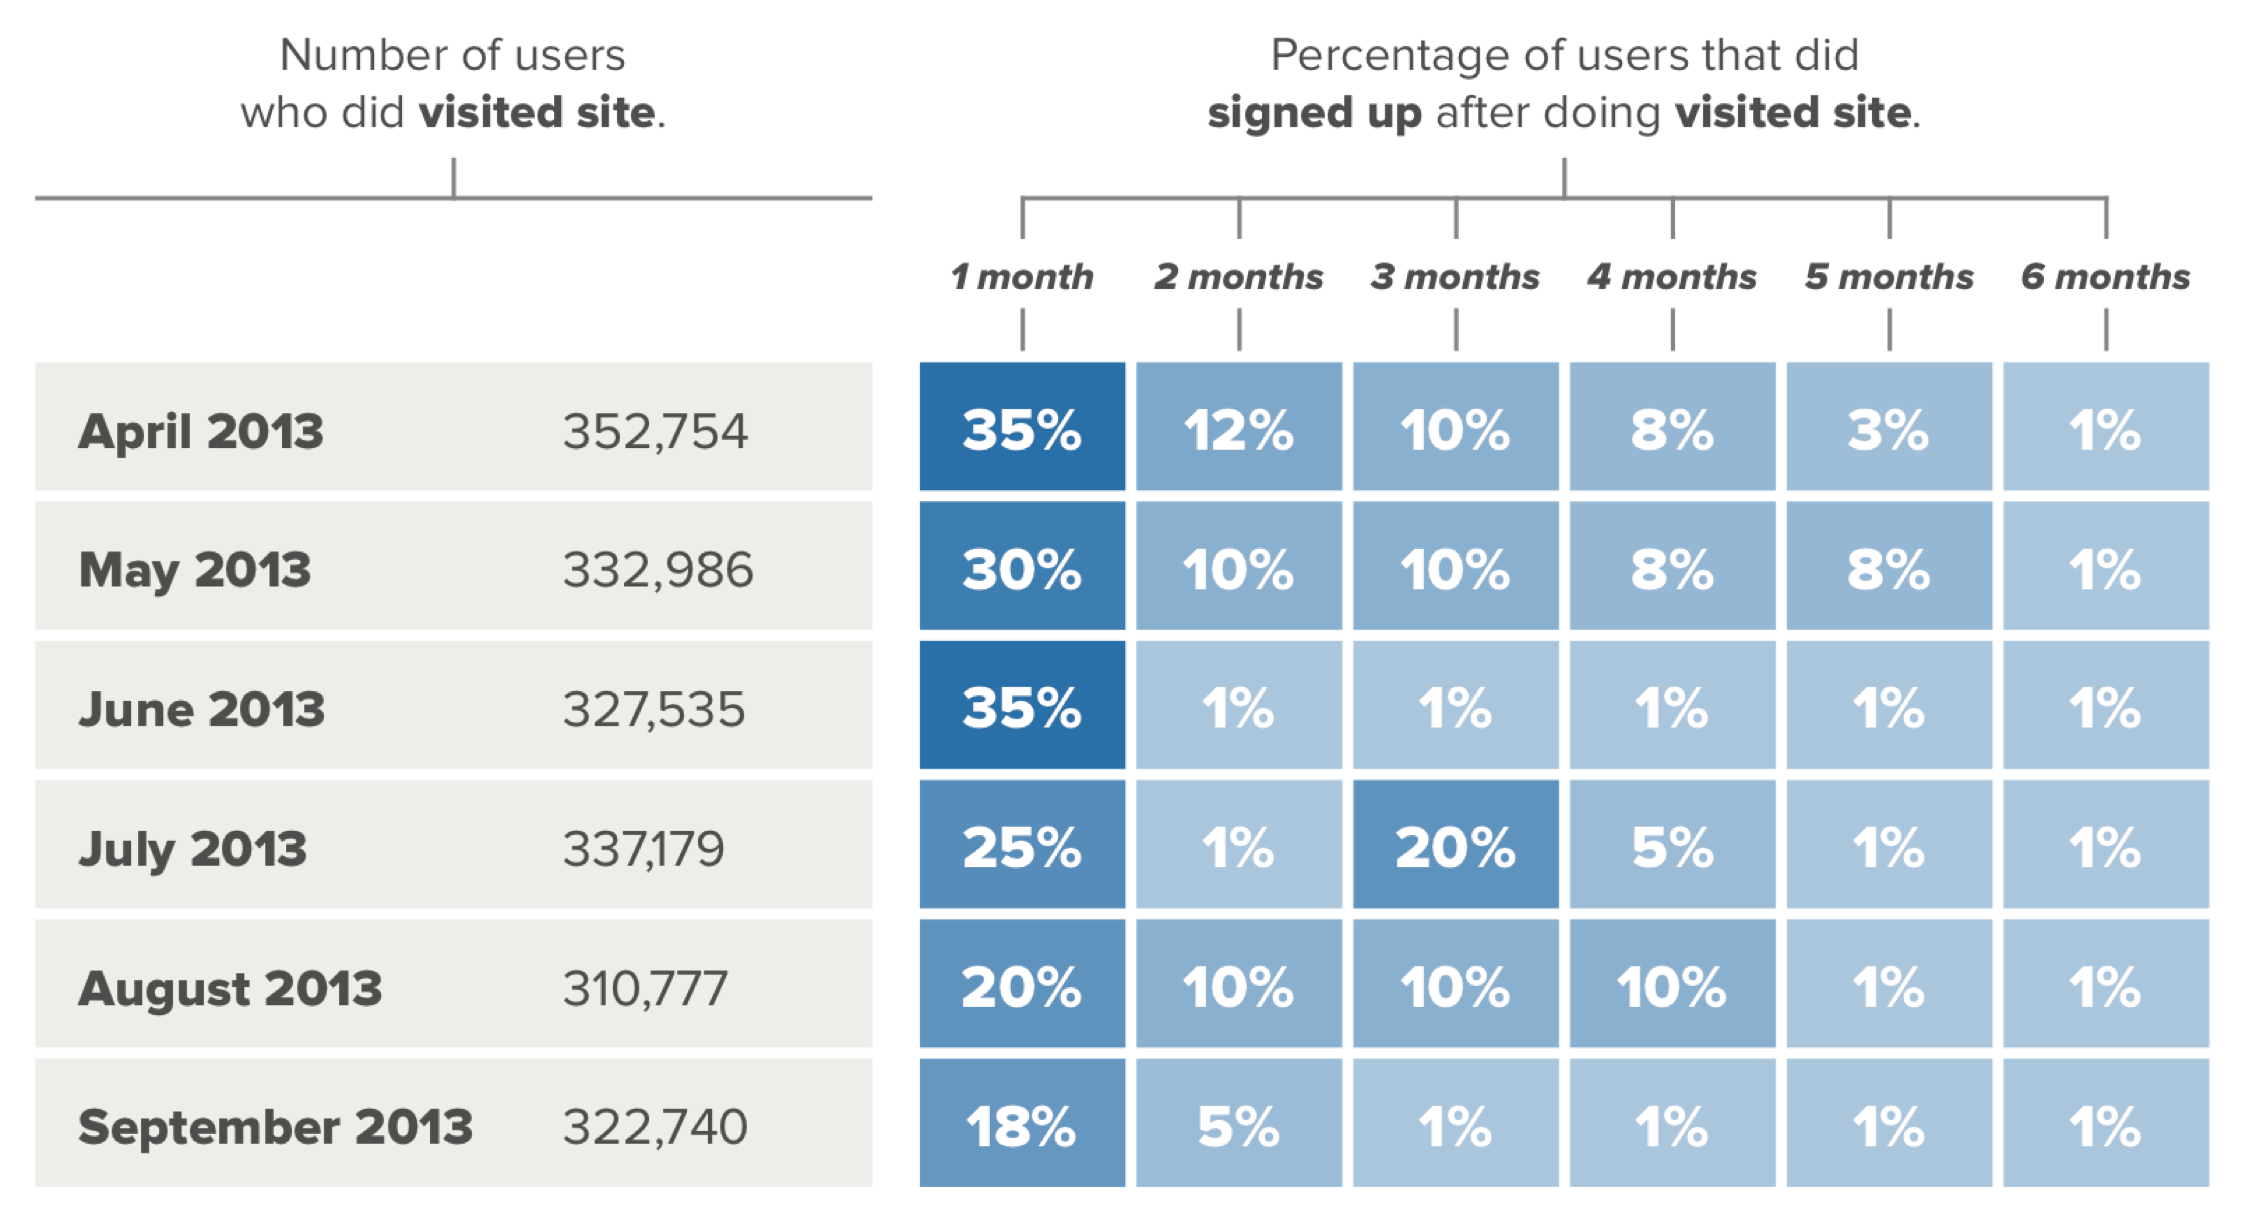
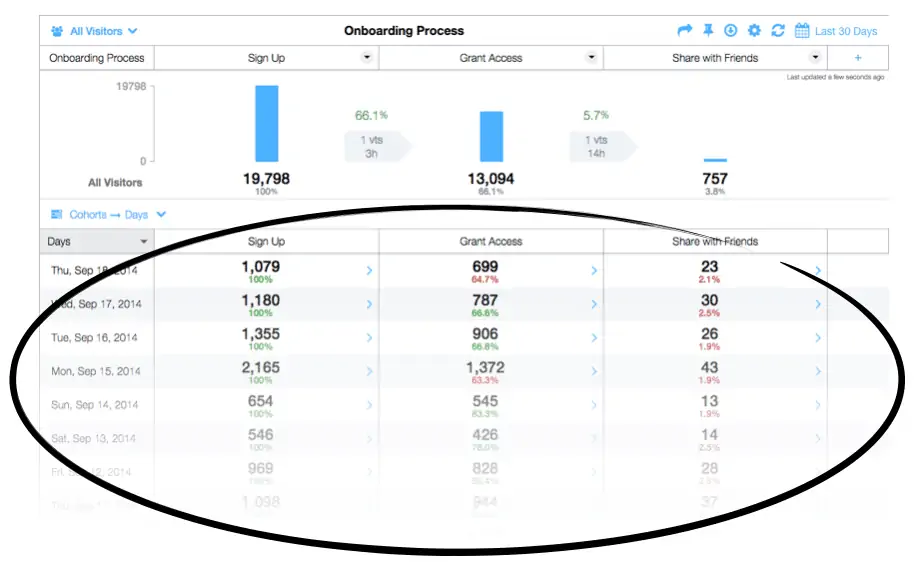
Here is an example that uses a few elements to get a more complete picture regarding User Retention. It’s tracking the Signup Day, the number of users and the retention over specific periods of time (1, 7, 14, 28 days).
- It’s actionable.
It really depends on the type of tracking software you’ll be using, but Cohort Analysis does provide a lot of answers. You just have to ask the right questions, in order to make informed decisions based on that data.
Bottlenecks and obstacles will be a thing of the past, if you take action after you understand the data.
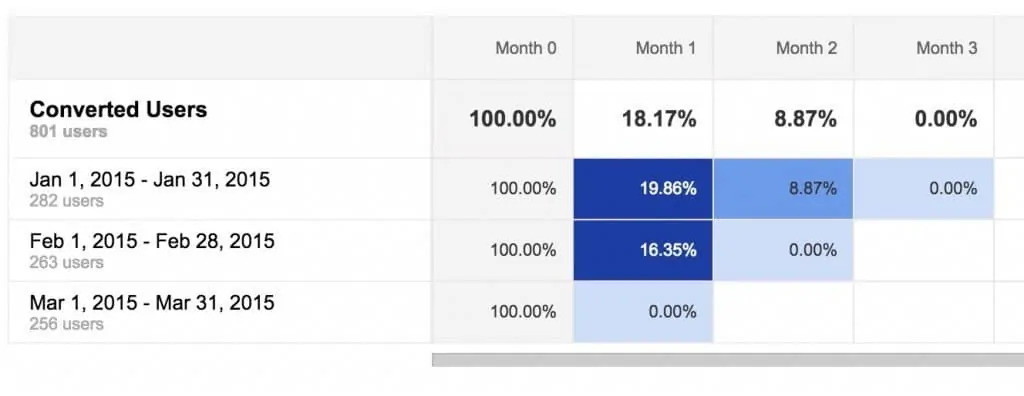
Imagine you’ve been tracking customer spending over time. You’re looking at a basic Cohort Analysis chart and you notice that monthly product usage begins to drop in Month 3, for all users. It’s not a technical issue, you’re pretty sure it’s not something to do with the time of the year.
You start to realize that users did not get the full benefit of being appropriately onboarded. That means they’ve probably gotten a basic Welcome Email about how to use the software and that was it. In order to make improvements, you can think about sending triggered emails (when the customer uses the app for 1 week, 1 month, etc.) and asking them for feedback.
In this particular example, it could simply be that they didn’t understand all the benefits of the app, so by month 3 they just gave up using it.
3. How Can You Use Cohort Analysis?
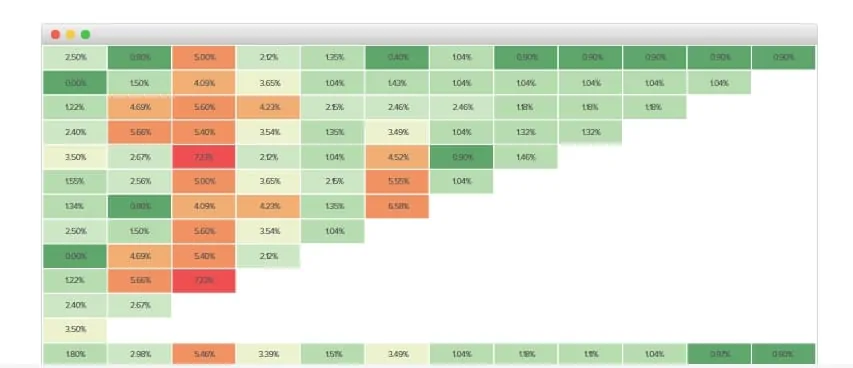
3.1 Predict Future Behavior In Terms Of Purchasing Power
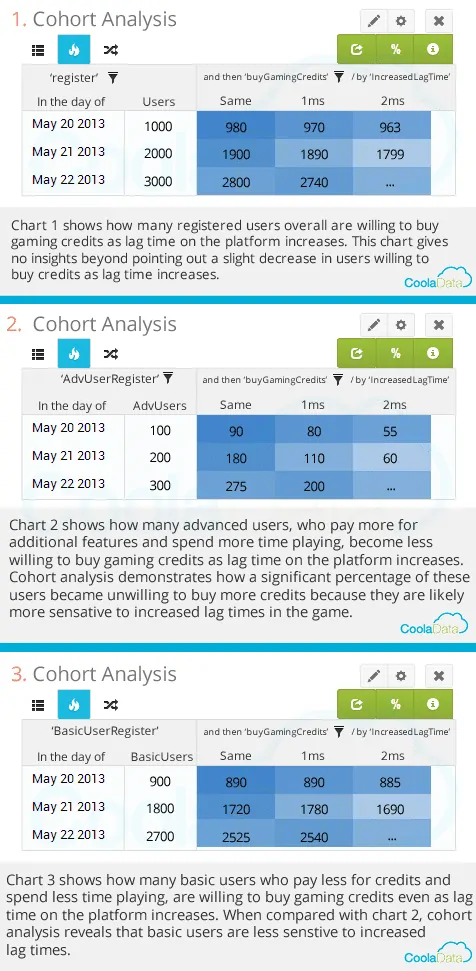
If you’re a gamer, you’ll understand this first example. Looking at the charts above you’ll soon learn that there is a direct connection between the preference towards buying credits and game lag. While registered and basic players still are interested in game credits as lag increases, expert/advanced players are much more sensitive.
In other words, the more gamers have to wait, the worse an experience they get in the game. And that translates to a lower desirability towards purchasing credits towards playing more.
You’re essentially segmenting users, looking at 2 data points and predicting future behavior. What you should be doing next is implementing user surveys. Deploying incentivizing campaigns and lowering lag time to increase overall credit purchases.
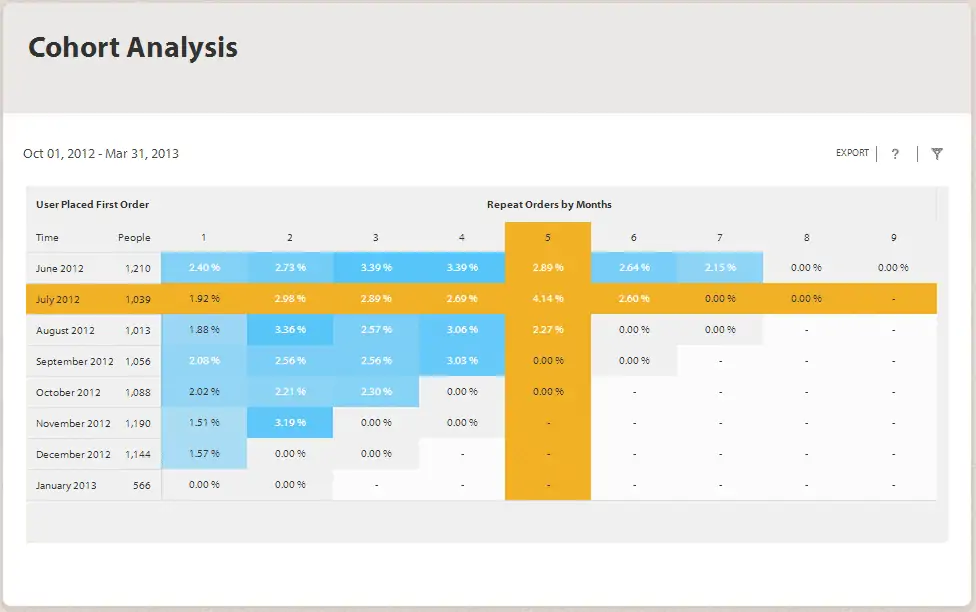
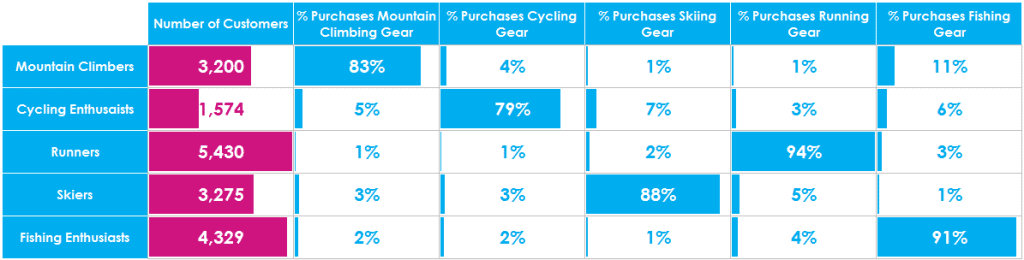
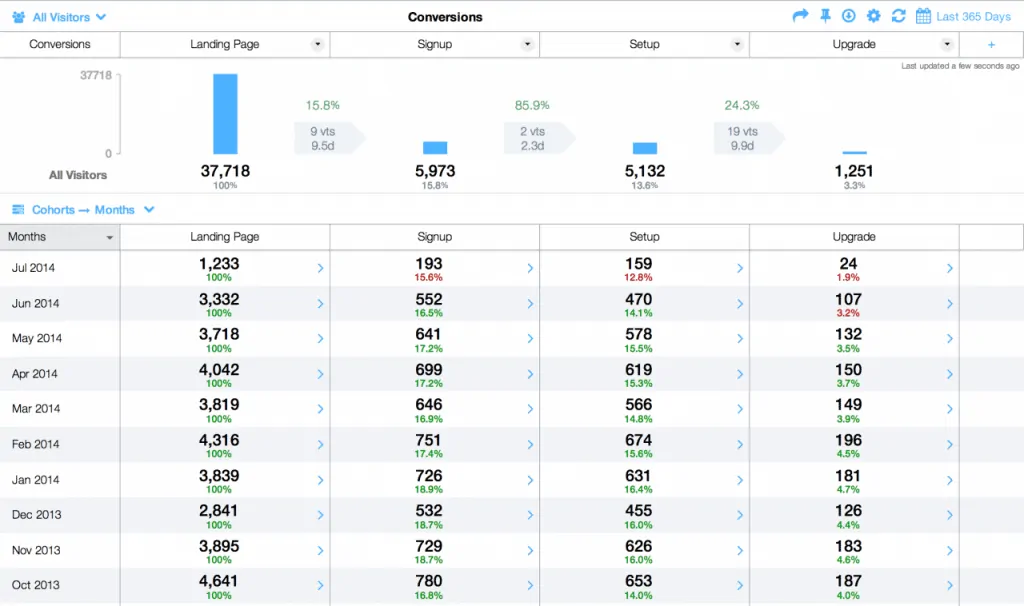
3.2 Estimate Acquisition Cost VS Lifetime Value
Things will not always be as simple as the table above makes it seem. But you can extract data from a Cohort Analysis and lay it out in a more convenient table format, to use for your own purposes.
The value that this type of analysis brings you is immense. Being able to know not only the acquisition cost for a user coming from a certain marketing channel, but also its lifetime value, makes it so that you can make smarter choices. Choices related to ad spend, content marketing and so on.
Once you have a good amount of actionable data, you can start working towards cost acquisition optimization. You can offer free trials, decrease initial upfront costs, implement a user referral campaign, etc.
3.3. Improve Lead Generation
Cohort Analysis is a lengthy process. Depending on the type of business you have and the services you provide, you will need a few weeks or months to gather data you can look at. But once you have that, you’re free to dig in and think about improvements.
In the case of a SaaS business, lead generation and trial-to-customer conversions are crucial. Without them, there would be no business. Let’s assume your free trial lasts for 14 days. That means that the users who signed up in Month 1 and stayed in Month 2 are paying customers.
That trial-to-customer Conversion Rate is simply a number. Without additional tools and data, you won’t be able to know if users are about to abandon your product. Framed is a service that uses machine learning to provide you with useful data so you can prevent and reduce user churn.
4. Cohort Analysis vs The Traditional Conversion Funnel
Funnels don’t make it easy to track long lifecycle events. They’re not meant to, as they weren’t built for that purpose. Unfortunately, they’re also pretty bad at tracking split tests and measuring retention (as that tends to happen over weeks and months).
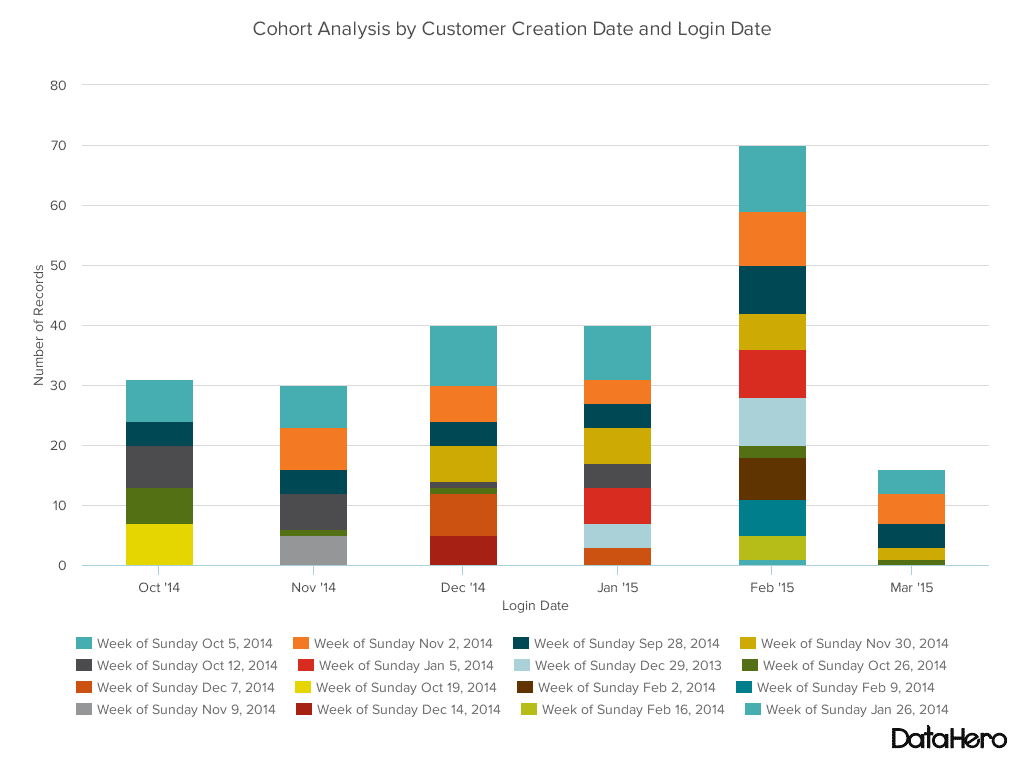
The Cohort Analysis doesn’t entirely replace the Conversion Funnel. In fact, they can work together to better visualize how certain events affect users’ behavior over time. By measuring key events that push leads towards conversion, you can get a feel for what works and what doesn’t. And since you’re looking at all of these across time, you can make changes and tweaks and see how it affects your end goal.
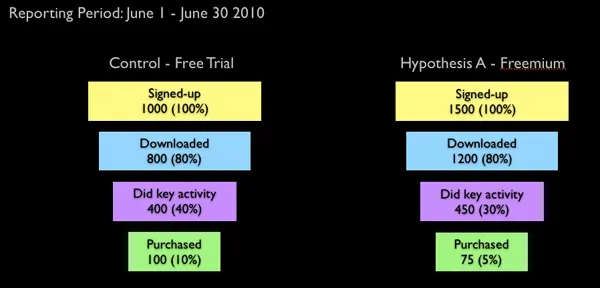
Split tests also function well if you’re tracking a variation from a Free Trial to a Freemium model, for example. The chart above (albeit not based on real data), shows how you can have the same actions side by side and compare them across lead conversion tactics. This is the first step, the next being actually implementing changes to figure out if you’re improving things across your Conversion Funnel. You might be surprised to see that a change you’ve made at the top of the funnel drastically increased conversions at the bottom of it.
The trick here, as with most Cohort Analysis you’ll perform, is to keep it really simple. If you make the mistake of adding too much data, you’ll lose yourself in all the different scenarios. The beauty of this type of analysis is that you can pull up certain elements you’re interested in and ignore others. Time is an important indicator and so is the Conversion Rate. Next, you’ll want to define and track key actions that your cohorts are performing. Once you have those, you’re ready to start optimizing and see how your visitors are acting inside of the Conversion Funnel you’ve implemented.
5. Examples Of Cohorts (Medical, Social, Sales, etc.)

Cohort Analysis is not restricted to digital marketing. Since it originated in the medical field, it’s worth nothing what other types of organizations, applications or business use cohorts.
- Medical
Does exposure to X (smoking) lead to outcome Y (lung cancer)? This is just one question that can be answered in the medical field, using cohorts. You essentially try to isolate the smoking element as the main cause of lung cancer.
You get 2 groups of people (smokers and non-smokers) and try to have them be as similar as possible. That way, their lifestyle won’t dramatically impact what leads to the outcome.
You then measure those cohorts over a set period of time and analyze the data. Based on that, you can repeat the test and figure out if your initial assumptions were accurate.
- Social
Are people who follow a few Twitter users more engaged in the platform at first? Twitter was having a challenging time making users who signed up use the platform for more than a few days.
Then, they realized it was all down to their social environment. If you create an account on a new social platform, there isn’t a lot to do. So now when you sign up for a twitter account, there are popular users recommended you should follow.
Twitter could compare the cohort that didn’t follow anyone with the cohort that had user suggestions. Overall, engagement and retention went up, so the experiment paid off.
- Sales
Do engaged users care more about your product? Do these users end up paying more and staying longer with the service?
Perhaps the most important type of Cohort Analysis is done at the sales level. You compare traffic sources and acquisition costs. You look at lifetime customer value and retention. You track the Conversion Rate from trial to paying users.
Having early user feedback is essential. It’s worth testing whether listening to your users, asking questions and making constant improvements to the products results in a higher number of monthly customers.
6. Cohort Analysis And A/B Testing
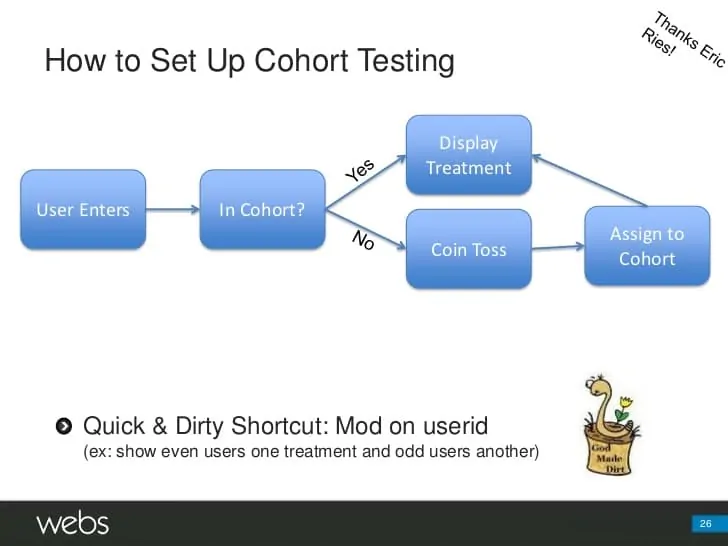
Things aren’t always as simple as you might want them to be. There are 3 main concepts we need to differentiate between cohort analysis, a/b testing, and multivariate testing.
6.1 Cohort Analysis
You use this type of analysis when your customer base is just too big to average all the data and behavior together. You get to focus on specific parts of the funnel – such as engagement or conversion and separate any elements you might thing have an influence on the outcome.
For example, if you implement a new website feature and your overall engagement with it is low, it’s a good idea to dig deeper and have a more granular view of your visitors. Once you look at them through this lens, you might notice that engagement is not low for every user. Old users understand your website better and are thrilled about the
Old users understand your website better and are thrilled about the improvement. New users, however, aren’t quite sure what to make of it and are skeptical of trying it out since they’ve just landed on the website.
6.2 A/B Testing
When testing big changes, you would use this type of analysis. A/B testing checks how two features are different, while Cohort Analysis sees how groups of users are different.
For example, if you’re using a landing page that only has one call to action, testing two different button colors is a simple way to figure out what issues your users might encounter. There are simply too few options to think about user behavior on a very detailed scale. A/B Testing is enough for this purpose.
Lastly, A/B Testing doesn’t require that much time to see initial data, but it’s limited to a more general view of the website visitors.
6.3 Multivariate Testing
You use this type of analysis and testing method when you’re checking a variety of changes at the same time. Multivariate Testing is usually reserved for making minor adjustments to a page rather than significant changes.
For example, if you’re testing a few changes to a checkout flow on an ecommerce website, Multivariate Testing will help you look at all the different factors at the same time. That’s both a good and a bad one – since you’re analyzing a lot more data simultaneously.
This type of analysis helps you understand user behavior even when one slight improvement or issue is related to another. You can trace users’ steps and make changes along the conversion path.
No matter what type of analysis you use, it’s important to remember that each is better suited for a specific task. In our case, use Cohort Analysis to look at behavior over longer periods of time.
7. Cohort Analysis And The Perfect Customer Persona
We’ve talked about Customer Personas in the past. Their importance in digital marketing cannot be overstated. Now we have another element in the mix: Cohort Analysis. How do the two combine? Let’s find out!
Customer Personas are entities built to represent groups of individuals, that share similar traits, personalities and interests. They’re created using customer surveys, in-person interviews, analytics data, forum and chat data, etc. If we look at DataHero’s article about personas, they’ve included Cohort Analysis to find more info.
Since we know that Cohort Analysis does well over more extended periods and is also predictive, it helps you understand your users better now and also in the future. That means that you can focus on past triggers’ actual behavior but also predict how they’ll react in a certain situation on certain pages. This gives you an incredible amount of data to play with.
Combine those cohorts with your usual Customer Personas, and you’re already one step ahead of the competition. While they’re looking at past actions and realtime traffic, you can keep your pulse on what’s going to happen to specific sets of users.
Imagine knowing that a visitor from Facebook will lose interest in your product by month two. Perhaps it’s because the platform offers instant gratification, the targeting might have been off, or a combination of those factors. Now, you’ll use that cohort data to implement email marketing campaigns to capture more leads. You’ll also deploy remarketing across your entire website. So that no matter what your visitors do, you’ll be able to track it, understand it, and take actions that benefit you.
You’ll be able to get a much better handle on customer churn and user retention if you remember to combine Cohort Analysis with Customer Personas. Since most of the tools are at your disposal, it would be a shame not to use this opportunity to provide more personalized marketing solutions for your users.
8. Cohort Analysis And Conversion Optimization
Source: KISSmetrics
Defining and using the right cohorts can mean the difference between user churn and increased conversions. Doing it from the outset will help you in the long run. The best way to think about the proper cohorts is that you’re not limited to just one action.
Let’s say you have a mobile game, and you want users to stay more within the app, return more often, and eventually purchase an in-game item. If you’re looking for a specific number for a good conversion rate, I’m sad to report that it is in the 2%-3% range. Let’s put it another way, if you’ve got 1.000 new users each month using your app, only 20 to 30 will buy something from the game. And they might only purchase once.
Given these stats, it is easy to see why conversion and retention optimization are crucial for your website or app’s survival. Moreover, Cohort Analysis is key to finding very specific user data you can act on.
Since you’ll be playing with data, understanding the difference between segments, cohorts, and personas is a useful piece of knowledge. This detailed article on the Moz blog gives you more insight into them.
9. Cohort Analysis And SaaS
In SaaS land, free trials are golden. Moreover, while services like HiMama, BambooCricket, and Kinsta do NOT offer free trials, they remain an excellent lead generation tactic for businesses. Of course, if providing one does not make sense, you probably shouldn’t.
Using this New Breed Marketing template, you get to determine things like:
- Free-trial-to-paid Conversion Rate by persona
- MRR generated by free trial by persona
- Customer churn by persona
- MRR churn by persona
- Cumulative revenue in lifetime month vs. CAC by
- and more
So, not only are you using cohorts to improve your SaaS business, but you are also integrating Customer Personas for an even more personalized service for your customers.
Remember, a traditional Conversion Funnel can only take you so far. Moreover, if you are waiting 6 to 12 months to recoup those initial free trial costs, you’ll want to use Cohort Analysis to see what impact that initial investment in your users had in the long run.
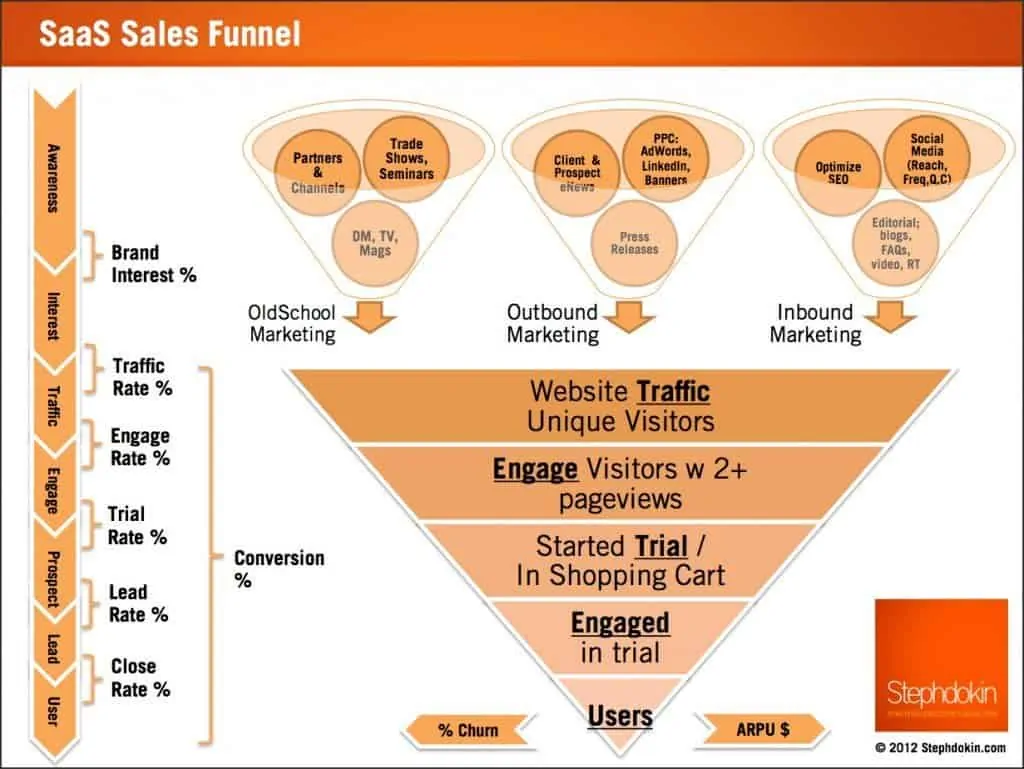
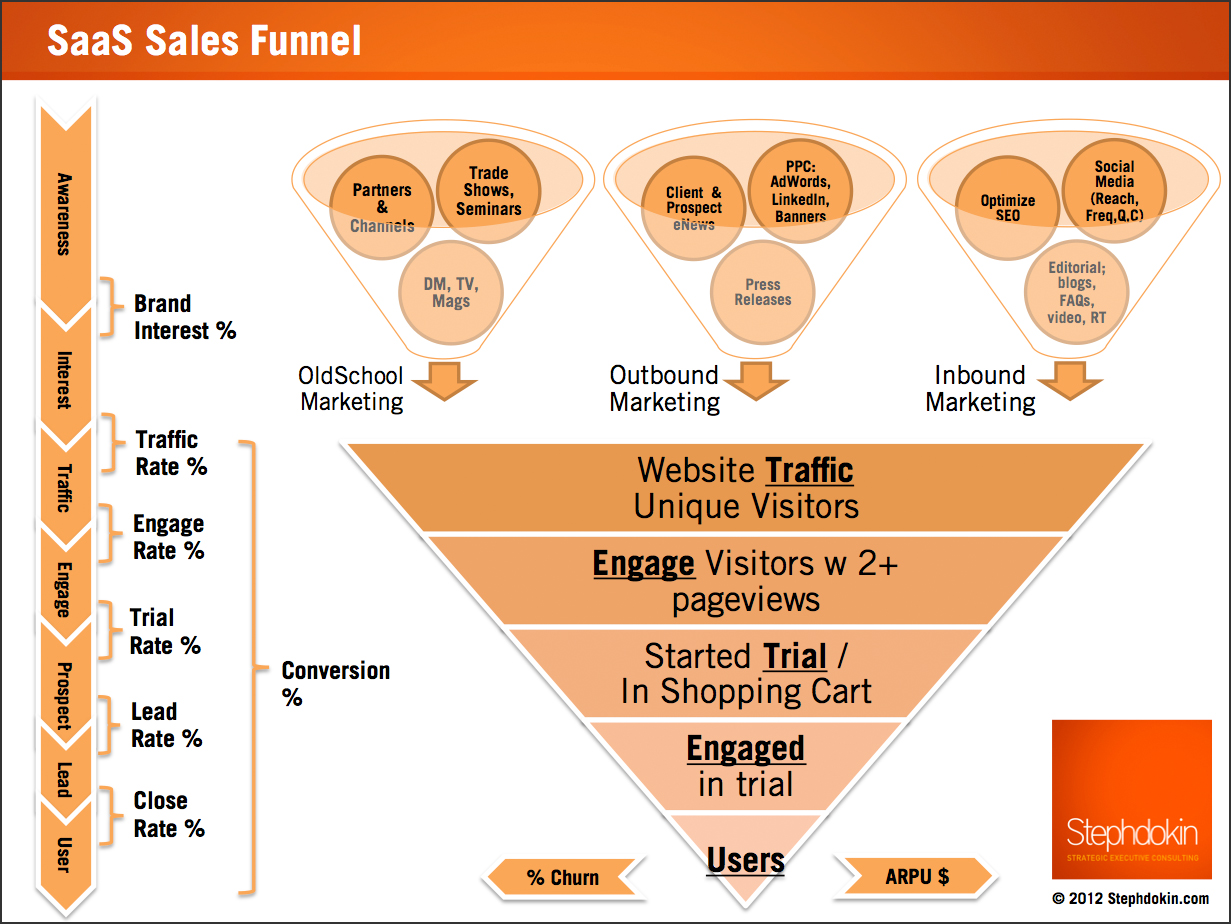
When your SaaS Sales Funnel tends to get a bit more complex, you need the right tools to measure Conversion Rates at each step. Lucky for you, Pierre Lechelle has put together an impressive list of tools, services, and info all about optimizing your SaaS business.
10. Cohort Analysis And Mobile Apps
[su_quote cite=”Alicia Shiu” url=”https://amplitude.com/blog/2015/11/24/cohorts-to-improve-your-retention/”]
Long-term success means not only getting someone to download your app but also getting them to come by day after day because you’ve built something that they can’t live without.[/su_quote]
DAU (Daily Active Users) and MAU (Monthly Active Users) are standard metrics anyone should track in their mobile app. You’ll need to dig deeper to grow your user base and retain more of them. Again, this is where Cohort Analysis comes in and saves the day.
Acquisition Cohorts and Behavioral Cohorts are the two largest cohorts to use for Mobile Apps. The first type shows you when and how your users signed up for/downloaded the app. The second type is more complex, tracking users’ actions within the app. These can range from just opening the app up to sharing it with their friends, buying in-game currency, and others. You’ll want to track how long these users stay with your app before they drop off.
What you’re looking for are predictable metrics that can help you understand how your users feel about your app. Most people employ review prompts and they track usage data. Based on this alone, you’ll have to see if users are interested in your app, if they’re using it out of boredom (nothing wrong with that), if they’re using it at particular times of the day, etc. Once you’ve started seeing patterns, you can improve your app and your in-app triggers to make them play more or share it with their friends for increased conversions.
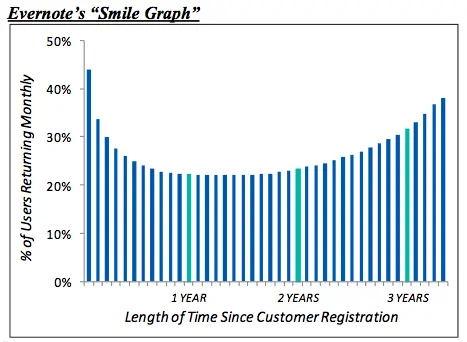
Take this graph from Evernote as an example. Over three years, their app retention is more significant year over year. That is because of the nature of the app. It is natural to use the app more at first and then return to it occasionally. However, since you are filling your account’s storage gradually, you find yourself using it more and more. So they end up with a “smile graph” and a negative churn. We should all be so lucky!
11. The Most Important Cohorts In Cohort Analysis

Your cohorts will vary depending on the type of business you are running. For SaaS, for example, you are tracking things like:
- MRR (Monthly Recurring Revenue). New user acquisition costs add up. Retaining more customers with a higher lifetime value is always better than trying to go for smaller clients with shorter lifespans.
Once you understand how much you earn per month vs. how much you burn, you can make plans and predictions for your products, services, and business. - VTCR (Visitor-To-Trial Conversion Rate). It is the classic Act element from the RACE framework. The bigger the number of visitors (Reach) and the higher your Conversion Rate at this step, the more users you’ll have signed up for your free trial.
Usually, the next phase in the funnel is transforming those trial users into recurring revenue clients. - TTPCR (Trial-To-Paid Conversion Rate). Once the trial is over, you’ll want to see how many of those users are happy enough with your product/service to want to pay you every month.
It is key here to start talking and listening to your customers as early as possible so you can get a feel for their pain points and help them accordingly. - MUV (Monthly Unique Visitors). You cannot have 1 million new clients a month without having at least 1 million new website visitors first (unless you somehow convert users outside of your site to some referral system).
When you plan for your business, once you go back from the MRR, you’ll end up at MUV. Not only quantity is important here, but also the quality of that traffic – a better lead is worth more than two bad ones.
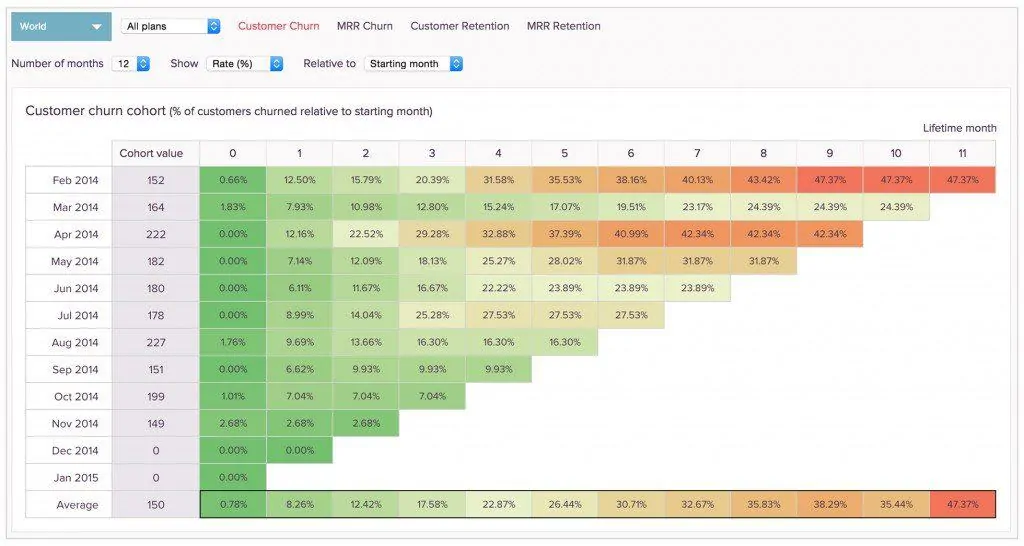
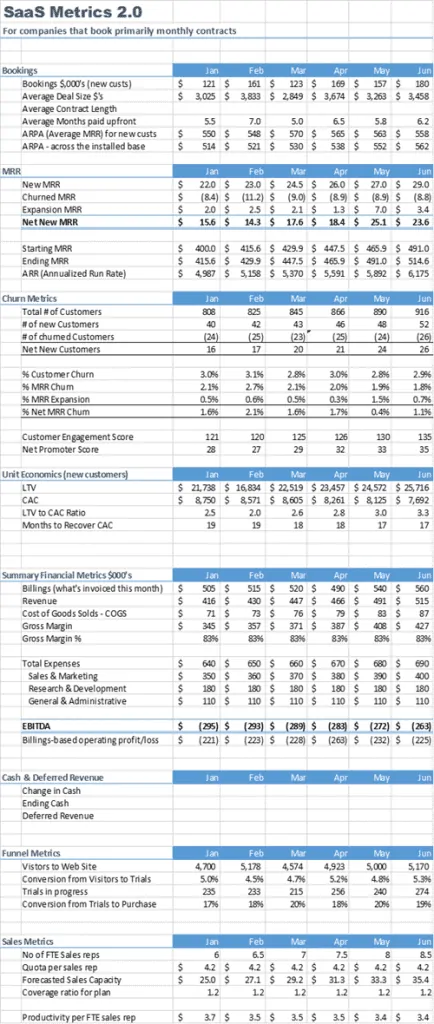
Since SaaS is a different beast than a regular business, you might want to track your metrics in a dashboard similar to this one:
But going back to cohorts themselves, you’ll want to track things like:
- Users by the week or month when they signed up(you can get a feel for particular periods of the year when signups are higher than other periods)
- Users by traffic source(this will help you understand which channel is the best for user acquisition in terms of quality and cost)
- Time first activated(when they first engaged with your website meaningfully – registered for the newsletter/webinar/demo, began a free trial, etc.)
- Usage frequency/intensity(based on this, you’ll think of ways to reward premium users or reduce the free trial limits)
- User entry mode(were users referred to the system, or did they sign up on their own?)
These help you gain a better understanding of your users’ motivations. You can see if they signed up on their own, if there are certain times when people sign up, or if individual sources convert better than others. Once you’ve decided to track all these, it’s time to move on to step 2: use the data to make decisions about your website.
No matter what you sell or your business model, you rely on your users to provide you with data you can work with. You can then implement new triggers, optimize signup forms, and provide a better experience based on location, time of day, traffic channel, etc. All this – to optimize your Conversion Rate.
12. Specialized Apps For Cohort Analysis
While Google Analytics recently added Cohort Analysis to its first package, it’s pretty limited now. Not only that but since it’s part of a more extensive analytics package, it’s hard to give you a complete and comprehensive experience. Therefore, we’ve assembled three apps we feel would help you more with your Cohort Analysis.
12.1 ChartMogul
Focusing on your SaaS business, ChartMogul integrates with Stripe, PayPal, Braintree, Chargify, and Recurly. This gives it access to your payment data to build custom recurring revenue reports.
Based on this data, it calculates your Monthly Recurring Revenue, Churn Rate, Customer Lifetime Value, and much more. Moreover, since it is your data, you can be sure the created dashboards will always be unique to your business. You will not have to adapt to other apps’ ways of showing you insights; ChartMogul adapts to you.
Cohort Analysis is much more visible here, emphasizing what’s driving your business forward and what’s holding you back. It doesn’t hurt that the overall graphical interface is better than Google Analytics.
12.2 RJMetrics

This allows you to connect the currently used apps to run and analyze your business to give you better insights. This helps you answer crucial questions like “Which of my ad channels has the highest ROI?”, “How many subscribers upgrade, downgrade, or churn [in a specified period]?” or “What’s the optimal price point for my products?”.
With RJMetrics, you get to define how your metrics are calculated. This means that no longer are you restricted to the default ways of measurement. If your revenue model is different for your business, that is great. Just define that as you see fit, and you are ready to go with the correct data.
RJMetrics is not meant to be a replacement for Google Analytics. In fact, it connects to Google AdWords, Trello, Stripe, Facebook Ads, Salesforce, and a lot more. They all work together seamlessly in RJMetrics’ dashboards.
12.3 Woopra
Initially just a basic analytics package, Woopra has come a long way since its launch. It now focuses on Real Time Customer Activity, whether your website, app, or both.
It builds comprehensive profiles for each one of your users. They are anonymous until they give you an email address or a phone number. After that, each action and interaction with your business becomes data in Woopra.
Based on your users’ behavior, build segments and analyze cohorts. Go further and use that data in your Funnel Reports, showing you where users drop off and their conversion journey.
Since it connects to other apps like Box, Qualaroo, MailChimp, SendGrid, Slack, and HubSpot, your data suddenly becomes actionable and you can send personalized messages and notifications to your users through those channels—time to say goodbye to the exact generic words for all your visitors.
13. Final Tips And Tricks
- Define your cohorts early on. Once you have key actions you want your users to take (sign up for the newsletter, buy in-game items, etc.), you can start defining your primary cohorts. Since you’ll be doing this at the beginning, you’ll better understand what’s going on with your business. Be patient and look at the most important actions first. Along the way, you can define secondary cohorts and even combine critical actions to build new ones. But don’t get too complicated at first.
- Pay attention to the right metrics for your business. Every business is unique. Even stores that sell the same type of sports equipment (for example) have different customers, locations, and prices. The cohorts that are used for one business may not apply to yours. Figure out what makes you unique and define your cohorts so that you can provide a great user experience.
- Don’t be afraid of paid apps for Cohort Analysis. We’ve mentioned a few apps in the previous chapter that can help you with your Cohort Analysis. Even though Google Analytics is free and does provide this type of analysis, it is not its main focus. Therefore, it is harder for it to compete with specialized apps that do just one thing much better. Since most offer a free trial, there’s no risk of trying them out. You might find that you are less frustrated by free Cohort Analysis apps, and you get great insights from these paid ones.
- Build upon your Customer Personas. Plan your key user actions according to your Customer Personas. You can place your Call To Action at the middle of the page all you want, but if your users are mostly scanners, they will only glance at your text and never pay attention to all of it. The same goes for apps, games, and websites. If you are not focusing your efforts on understanding your users and their behavior, you are missing out. Use a couple of customer personas and cohort analyses to get an overview of what’s working and what needs to be improved in your business.
- Use the Conversion Funnel together with Cohort Analysis. The Conversion Funnel is not obsolete; it is just incomplete. It is definitely not broken, but it needs to adapt to the new digital marketing scenario. One where you are looking at a lot more data than before. A scenario where you can customize and improve your users’ experience, based on the data that they provide to you. Improve your existing Conversion Funnel by adding another layer of Cohort Analysis on top of it. You’ll be surprised and delighted by the results if everything goes according to plan.
14. Recommended Reading: Articles And Guides
14.1 Articles
What is A Cohort Report and Why Is It Valuable?
Google Analytics Visitor Segmentation: Users, Sequences, Cohorts!
14.2 Guides
What Is Google Analytics Cohort Analysis? Your Detailed Guide
Comments are closed.