You can automate SEO reporting by connecting your data to Claude and having it draft the same six-section report each month. Data pulls, comparisons and the first draft can all run without you. The explanation still needs a person, because in one real client month, four headline numbers said something different once I checked them. This guide covers the template, the data and those checks.
Disclosure: links marked “affiliate link” in this post go to DataForSEO and SE Ranking. If you sign up through them, I may earn a commission on every successful sale, at no extra cost to you. The client is anonymized.
What can you automate in an SEO report?
You can automate data collection, period comparisons, winners and losers, and the first draft. Deciding why a number moved, and what to tell the client, should stay with you.
| Report task | Automate it? | Why |
|---|---|---|
| Pulling clicks, sessions and rankings | Yes | The same data is needed every month |
| Comparing periods | Yes | Code applies the same date windows each time |
| Listing winners, losers and shipped work | Yes | This comes straight from the data and your log |
| Explaining why a number moved | Draft only | Claude proposes causes, and you check them against live pages |
| Claiming that your work caused a gain | No | Too early is often the honest answer |
| Choosing what the client should decide | No | This depends on the business and the relationship |
What should a monthly SEO report include?
A monthly SEO report should include a one-paragraph summary, the numbers, winners and losers, the work shipped, what moved because of it, and next month’s candidates. Keep that order every month.
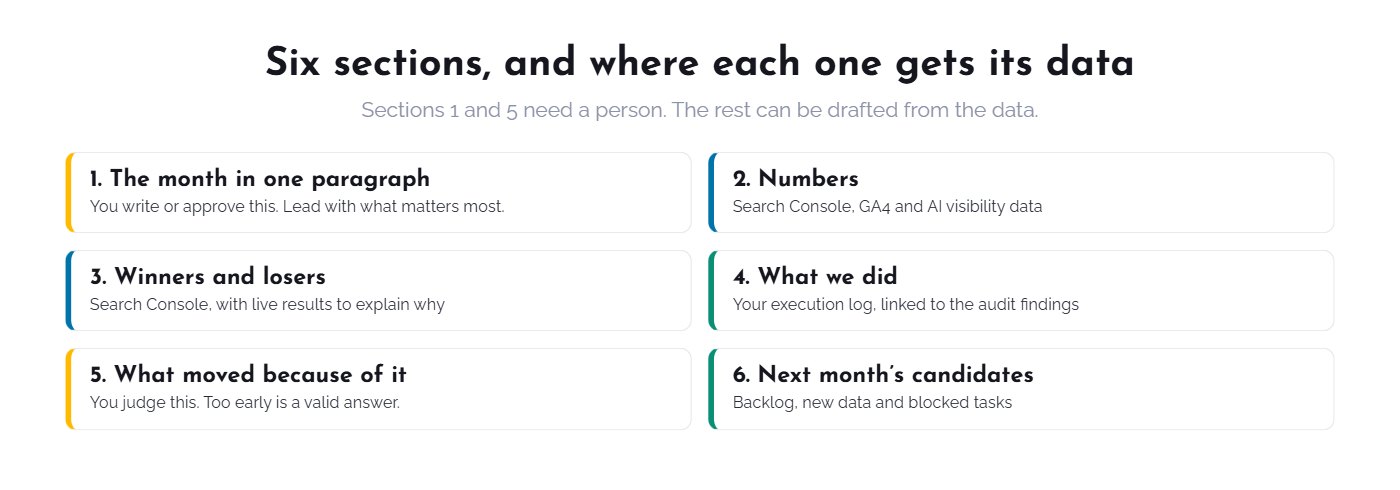
The last section matters most for automation. Next month’s candidates become the starting list for the next audit, so each report feeds the following month. I show that loop on real work in one anonymized client month in Claude Code.
Where does each number in the report come from?
Search Console and GA4 report what happened on your site. A rank and AI tracker adds positions, and DataForSEO adds the market view. Your execution log supplies the work.
| Question in the report | Source | Example cost |
|---|---|---|
| What did clicks and impressions do? | Search Console | Free |
| What did sessions and conversions do? | GA4 | Free |
| Where do tracked terms rank, and what is our AI share of voice? | SE Ranking (affiliate link) or a similar tracker | Your plan |
| Is the drop ours or the whole market’s? | DataForSEO (affiliate link) Labs, ranked keywords | 2 domains, 300 rows each: $0.096 |
| What does the results page look like now? | DataForSEO SERP API, live | 10 queries: $0.02 |
| Do AI answers mention the brand? | DataForSEO LLM Mentions | 100 rows: $0.20 |
| What did we ship? | Your execution log | Free |
Those three DataForSEO pulls come to about $0.32 per report at list rates from 27 October 2026. That figure is an example, because my usage export does not split spend by client. My pricing post shows 30 days of real spend across my whole account.
What does an SEO report template look like when it is filled in?
A filled-in SEO report leads with the main change, explains it in plain language, and ends with one clear decision. Here is the opening of a real client report from 2 November 2026, redacted.
| Headline number | This month | Note |
|---|---|---|
| Organic clicks | Down 19.5% | 1 to 29 October against 1 to 29 September |
| Brand click-through rate | 23.1%, down from 29.5% | Brand impressions flat |
| AI share of voice | 11.2% | ChatGPT citations rose from 28 to 208 |
| Sale page | 1 click | On about 167,000 impressions |
The short version. October fell a fifth, and it is three separate things. Brand searches held, but fewer of them clicked through to us. [Main category term] stopped sending clicks in mid-October. Informational blog traffic softened with the season.
The results page for [main category term] changed shape. It now leads with an AI Overview and product grids, and our page is out of the top ten. A leading competitor fell in the same month, so part of this is the market.
One decision needed: [the change that needs the client’s approval].
You can use this as a template. State the size of the change, name each cause, say what you checked, and ask for one thing. Numbers without causes are what a dashboard already gives the client.
Why can’t you send an automated SEO report without checking it?
You can’t send it unchecked because a correct number can still support the wrong conclusion. These four readings came from one client month, and an automated summary could have stated each one confidently.
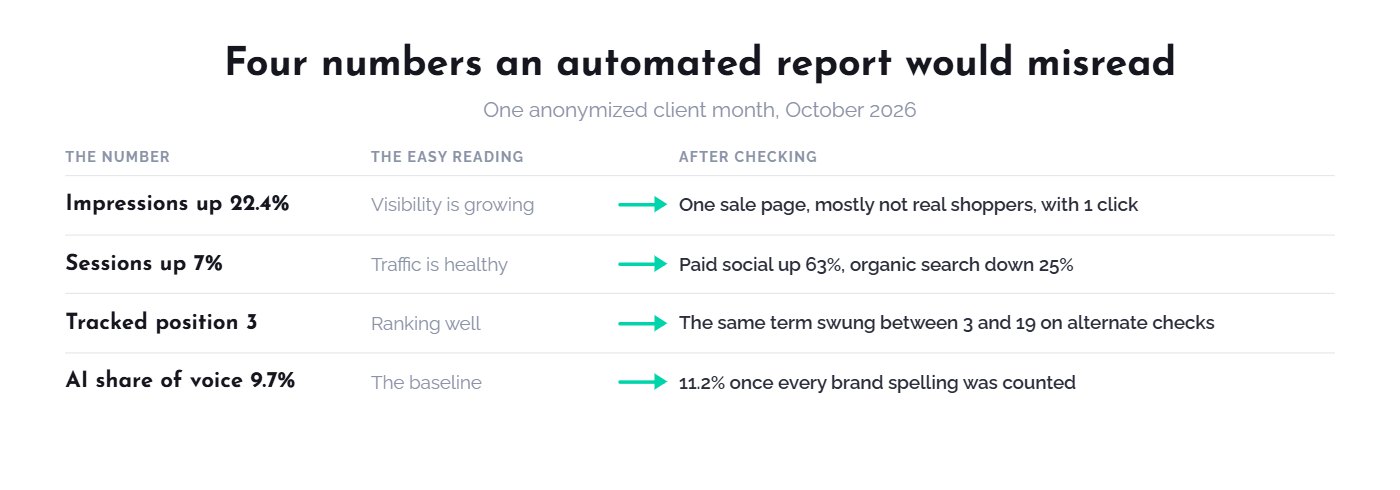
- Impressions rose 22.4% while clicks fell. A single sale page earned about 167,000 impressions and one click, and most did not look like real shoppers. Read alone, the total suggests growing visibility.
- Sessions rose 7%, carried by paid social. Paid social grew 63% while organic search sessions fell 25%. Always report the SEO channel separately.
- A tracked position swung between 3 and 19. The main category term moved that far on alternate checks, so a single reading could show either. Search Console clicks told the steadier story.
- AI share of voice read 9.7%. The tracker matched one spelling of the brand. Counting every spelling gave 11.2%, and that became the baseline.
Two habits help. Compare equal date windows, because Search Console data arrives about three days late. And check each claim against a second source before the report reaches the client. On that account, an AI mentions pull also returned the same figure for September and October, so I quoted no change from it.
Should you use a dashboard tool or Claude for SEO reporting?
Use a dashboard tool when the client wants current numbers on a schedule. Use Claude when the client needs the numbers explained. Many accounts need both, because they answer different questions.
| Route | Best for | Weak spot |
|---|---|---|
| Looker Studio with Search Console and GA4 | A free live dashboard | It shows what changed, and the reader works out why |
| Scheduled reports in Semrush or Ahrefs | Teams already paying for those suites | Limited to that tool’s data and layout |
| White-label builders such as SEOptimer or DAXRM | Branded PDFs across many clients | Monthly fees, and commentary is still up to you |
| n8n with an AI step | A fixed report on a schedule | Rules are set in advance, so odd data passes through |
| Claude Code with your data | A written report tied to the work you shipped | You start each run and review every claim |
I use the Claude route for client reports. The other rows reflect what those products publish, and I have not compared them side by side.
How do you set up automated SEO reports in Claude?
Set up one project folder per client, connect your data, keep an execution log, and save the report structure as a skill. The first report takes the most checking.
- Create the client folder. Keep each month’s report and execution log together in Claude Code, so the next report can read the last one.
- Connect the data. Add Search Console through an MCP server or a monthly export, then follow my DataForSEO MCP setup guide for the market view.
- Log the work as you go. A report can only connect results to work that was recorded, so note each shipped task with its URL and date.
- Save the structure. Put the six sections and your voice rules into a Claude skill, so every month reads the same.
- Record each correction. When you fix a claim, add the check to the skill, so that mistake does not come back.
My free pack includes this as seo-report, the last of four stages that run a client month. Get the free Claude SEO skill pack. If you need the market data too, open a DataForSEO account (affiliate link). More guides on this stack are in the DataForSEO + Claude hub.